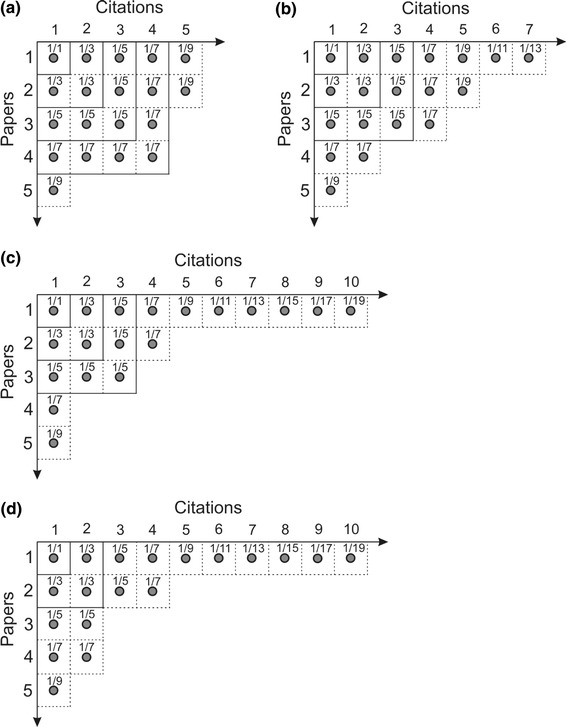
Fig. 1.

Examples of Ferrers diagrams representing citations of four fictitious scientists A, B, C and D, who published five papers each which earned a total of 19 citations. The order of decreasing citations of the papers is: a 5, 5, 4, 4, 1 for scientist A; b 7, 5, 4, 2 and 1 for scientist B; c 10, 4, 3, 1, 1 for scientist C; and d 10, 4, 2, 2, 1 for scientist D. Note that scientist A has h = 4, B and C have h = 3, whereas D has h = 2
