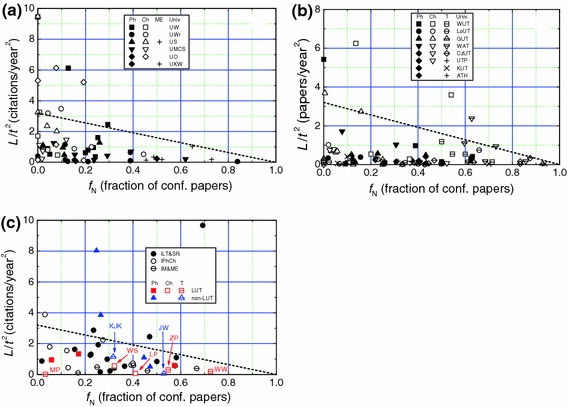
Fig. 9.

Dependence of L/t 2 on fraction f N of conference papers for various scientists working in a traditional universities, b technical universities and c PASc institutes, LUT and non-LUT. Dashed lines denote slope −3.2. The value of L/t 2 = 3.2 at f N = 0 corresponds to publication rate ΔN = 4 papers/year and citability 0.8. Total number of professors analyzed in the figures is 183
