
Figure 1.
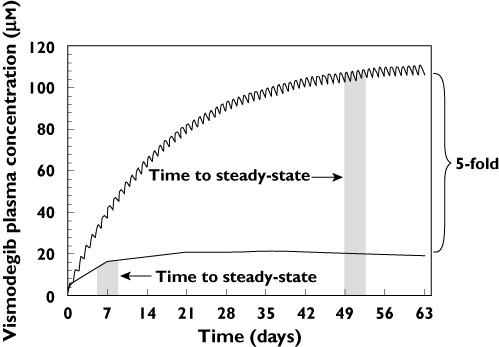
Actual and predicted vismodegib plasma concentration–time profiles. The simulated line shows expected levels of vismodegib accumulation based upon single dose PK parameters using the principle of superposition. The average steady-state concentration reported from a phase 1 study in cancer patients was markedly lower (5-fold) than the simulated concentrations [6]. The lower than expected accumulation could result from a concentration-dependent change in clearance, bioavailability or both, as demonstrated by equation 1