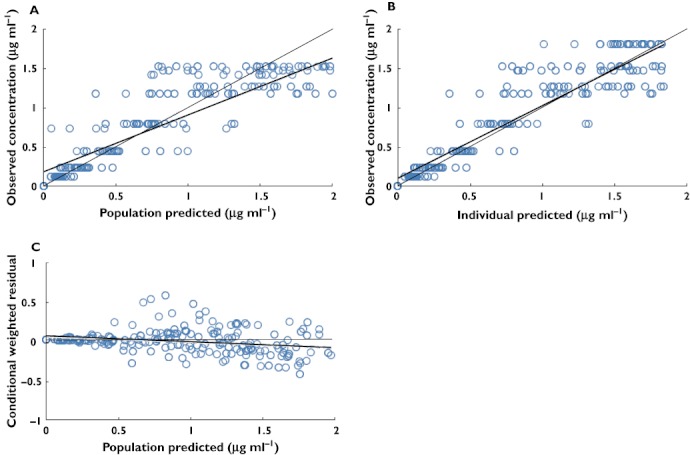
Figure 3.

Goodness of fit plots for final covariate pharmacokinetic model. The thin solid line is the line of identity and the thick solid line is the trend line. (A) Typical predicted (PRED) vs. observed metformin concentrations, (B) Bayesian predicted vs. observed metformin concentrations and (C) conditional weighted residuals vs. PRED
