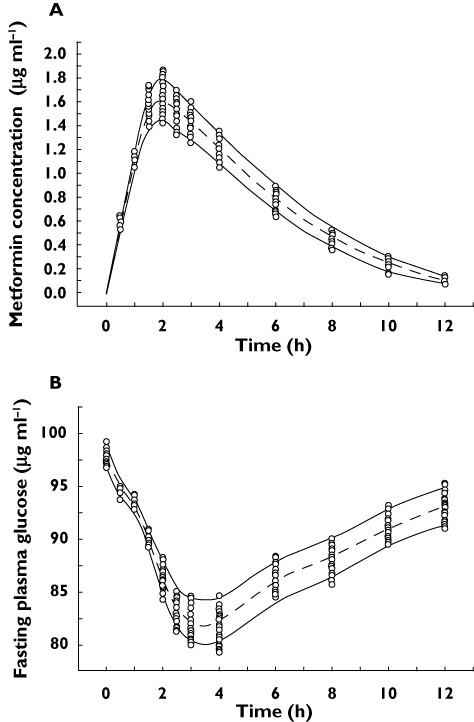
Figure 5.

Visual predictive check: Observed and model predicted metformin concentrations (A) and observed and model predicted fasting plasma glucose levels (B) following administration of metformin 500 mg to healthy humans.  5th and 95th percentile, simulated,
  median, simulated and
  observed concentrations
