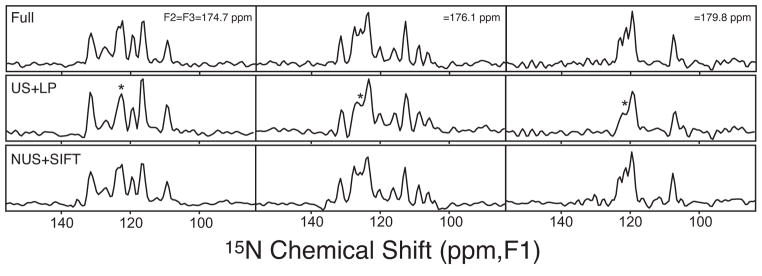
Figure 3.
Representative F1-slices through crowded spectral regions. Each column compares the spectrum of the full data (top), LP of truncated US data (middle), and SIFT-processed NUS data (bottom). From the left to right, slices were taken at F2=F3=174.7, 176.1, and 179.8 ppm, respectively. The vertical scale is the same throughout each column. The asterisks mark the unresolved peaks in the LP spectra.

