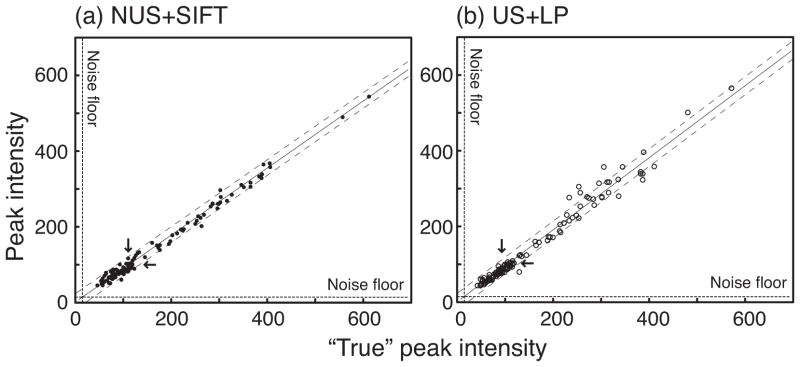
Figure 4.
Signal intensities observed in the spectrum of (a) SIFT-processed NUS data and (b) LP-processed US data vs. the fully sampled reference data. The linear regression shown with a solid line is slightly different between (a) and (b). Dashed lines flanking the regression line show the intrinsic noise width in the reference spectrum. Dashed lines along the x- and y-axes show the floor of noise standard deviation. The medians of all the observed signal intensities in the reference, SIFT-processed and linear-predicted spectra (marked by arrows) were about 110, 100 and 95 respectively.

