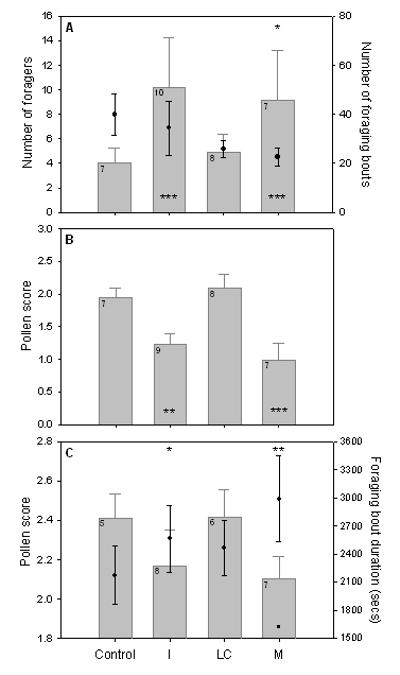
Fig. 2.

Foraging performance. A) Mean (±s.e.m.) number of foragers per colony (column), and foraging bouts per worker per colony (filled circles: n=259 foragers). B) Mean pollen score per worker per colony for all observed foraging bouts (n=228 foragers). C) Mean pollen score per successful foraging bout for each worker per colony (column), and mean duration of successful foraging bouts per worker per colony (filled circles) (n=147 foragers). Significant differences from Control treatment for column data shown at base of columns, and for filled circle data shown above columns (panels A and C). n colonies shown in top left corner of columns.
