
Figure 3. Dependence of MT polymerization dynamics quantification on temporal resolution.
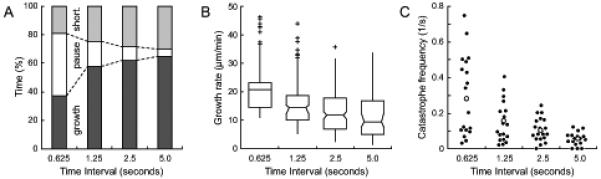
(A) Time MTs spend in different phases, (B) Growth rates, and (C) Catastrophe frequencies as a function of frame rate. 19 MTs from the sequence in Fig. 2 were analyzed, and simulated frame rates were obtained by temporal sub-sampling.