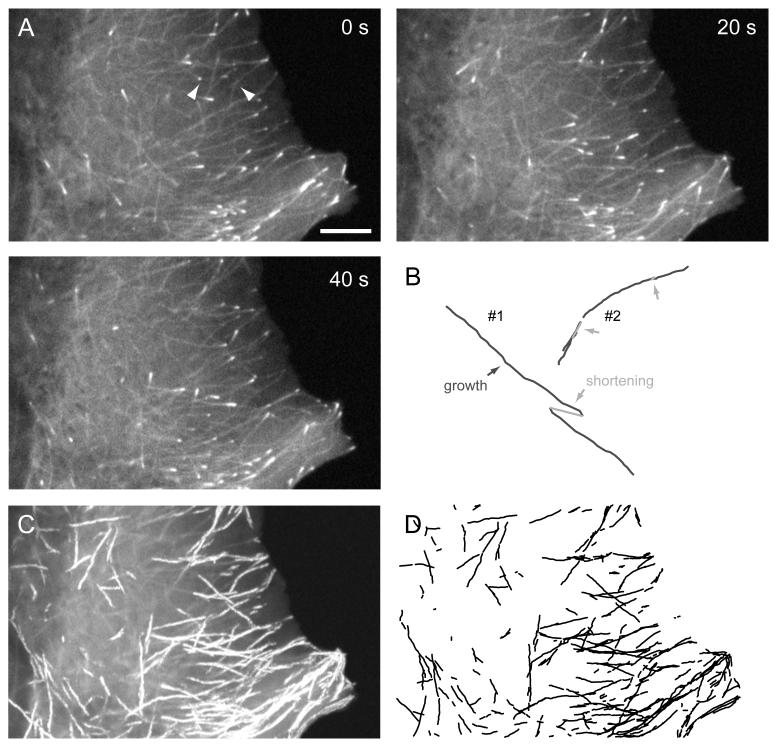
Figure 5. +TIPs as reporters of MT polymerization dynamics.
(A) Images of EGFP-tagged EB1 from the same dual-wavelengths time-lapse sequence as in Fig. 2. Scale bar, 5 um. (B) Computer-generated growth tracks of the same two MTs as in Fig. 2 with shortening events (light grey arrows) inferred by geometrical cluster analysis. (C) Maximum intensity projection of the entire image sequence directly showing EB1-EGFP growth tracks. (D) Computer-generated growth tracks with a minimum life-time of four frames demonstrating high tracking fidelity.

