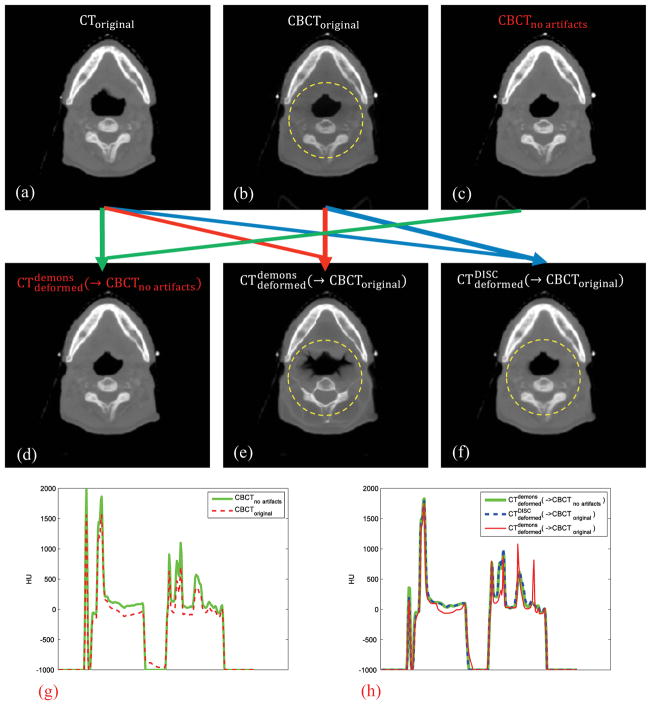
Figure 1.
Simulation and registration results. The yellow dashed circles indicate the regions which severely suffer from the scatter artifact. The green arrow indicates the DIR between CToriginal and CBCTno artifacts using the original demons algorithm; the red arrow indicates the DIR between CToriginal and CBCToriginal using the original demons algorithm; the blue arrow indicates the DIR between CToriginal and CBCToriginal using DISC. (g) and (h) are the corresponding vertical intensity profiles through the image center.

