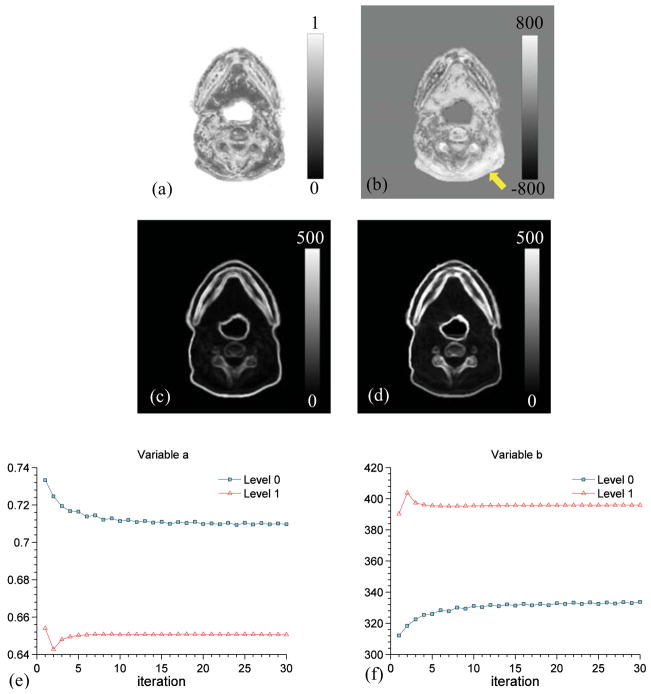
Figure 10.
(a) and (b): Distributions of parameters a and b on one transversal slice, respectively. The arrow indicates where the artifact presents in the original CBCT image; (c) and (d): Standard deviation of image intensities in each patch in Im and Is at the last iteration; (e) and (f): Evolution of average a and b values with iteration at two image resolution levels, respectively. The results are for Case 2.

