
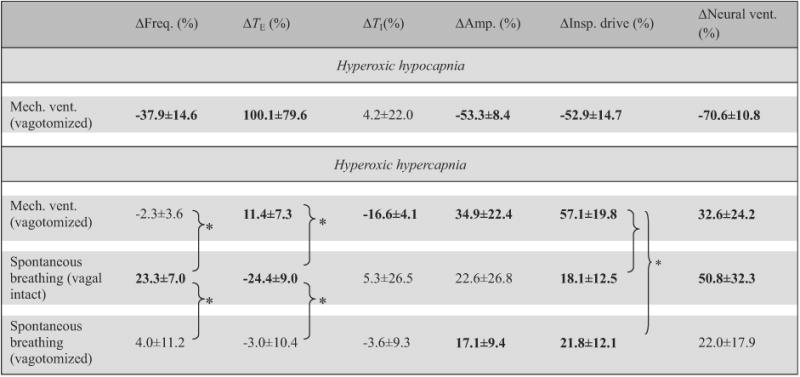
Table 2.
Effects of hypercapnia/hypocapnia in hyperoxia on breathing pattern in different respiratory modes.
|
Data (means±SD, n = 5) are percentage changes from corresponding hyperoxic–normocapnic baseline values (Eq. (1b)). * Statistically significant difference between specific pairs only. Bolded entries indicate statistically significant differences from zero.