
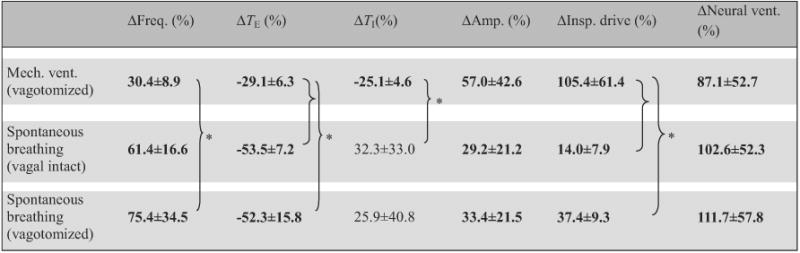
Table 3.
Breathing pattern response to hypoxia under normocapnic background in different respiratory modes.
|
Data (means ±SD, n = 5) are percentage changes from corresponding hyperoxic normocapnia background values (Eq. (2b)). * Statistically significant difference between specific pairs only. Bolded entries indicate statistically significant differences from zero.