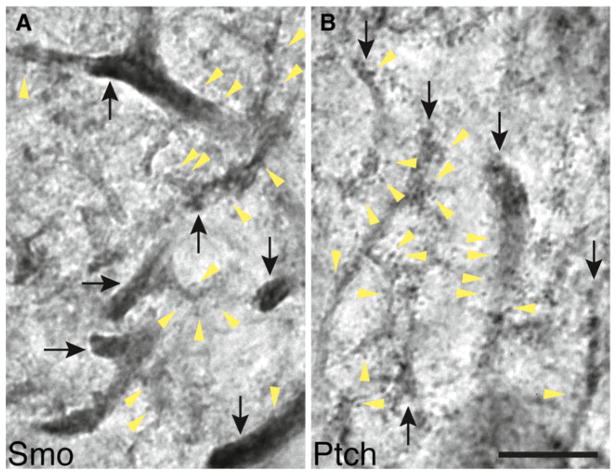
Fig. 3.
Distribution of Smo and Ptch1 in the dendrites of Purkinje cells in the adult cerebellum revealed by immunoperoxidase/DAB light microscopy. a Smo labels more intensely in dendrites (black arrows) than it does in the dendritic spines (yellow arrowheads). b In contrast, Ptch1 antibody labels the dendritic spines (yellow arrowheads) equally to or more intensely than it labels in dendrites (black arrows). Note that a part of the Purkinje cell body is visible in the lower right. Scale bar, 10 μm

