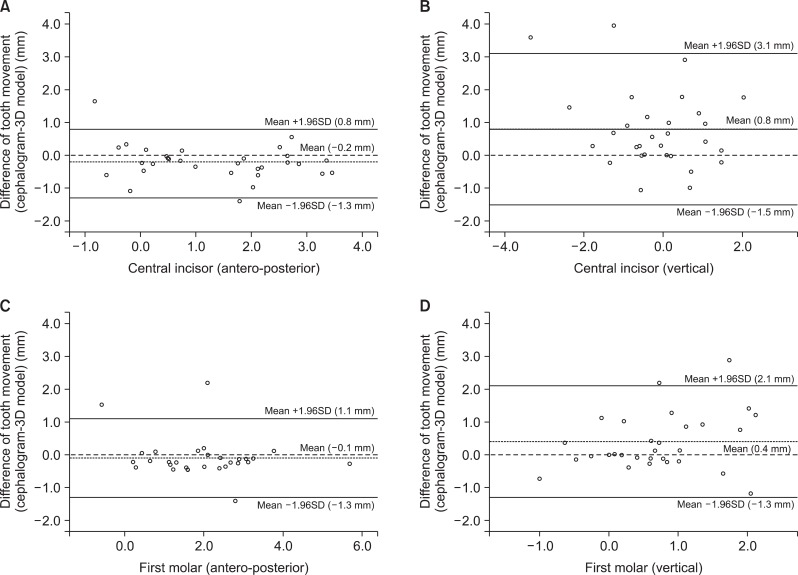
Figure 4.
Bland-Altman plots portraying the agreement between cephalometric and 3-dimensional (3D) measurements for A, antero-posterior tooth movement of central incisors; B, vertical tooth movement of central incisors; C, anteroposterior tooth movement of first molars; and D, vertical tooth movement of first molars. Each circle represents the difference between the measurements determined by the 2 methods (Y-axis) relative to the average of tooth movement measured by the 2 methods (X-axis). The thick lines indicate the mean, and the thin lines show the 95% limits of agreement.

