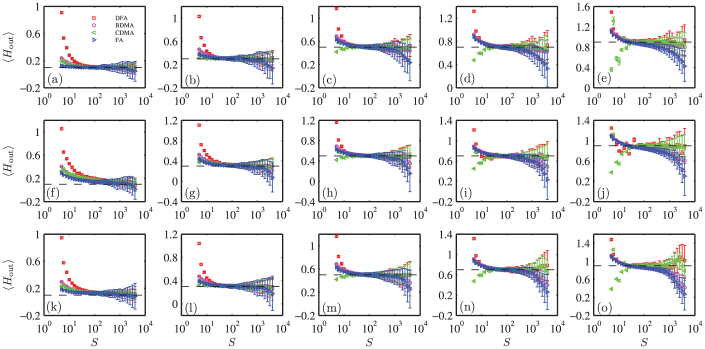
Figure 2. Local slopes of the fluctuation functions.
Each plot contains four curves obtained from four different scaling analysis methods (FA, BDMA, CDMA and DFA) and each curve represents a slope function averaged over 100 repeated simulated time series with the error bars showing the standard deviations. The three rows correspond to three generators (FGN-DH, FBM-RMD and WFBM from top to bottom). Each column corresponds to a fixed Hurst index (Hin = 0.1, 0.3, 0.5, 0.7, and 0.9 from left to right). The horizontal dashed lines indicates the exact value of the Hurst index used to generate the synthetic time series.

