
Figure 2.
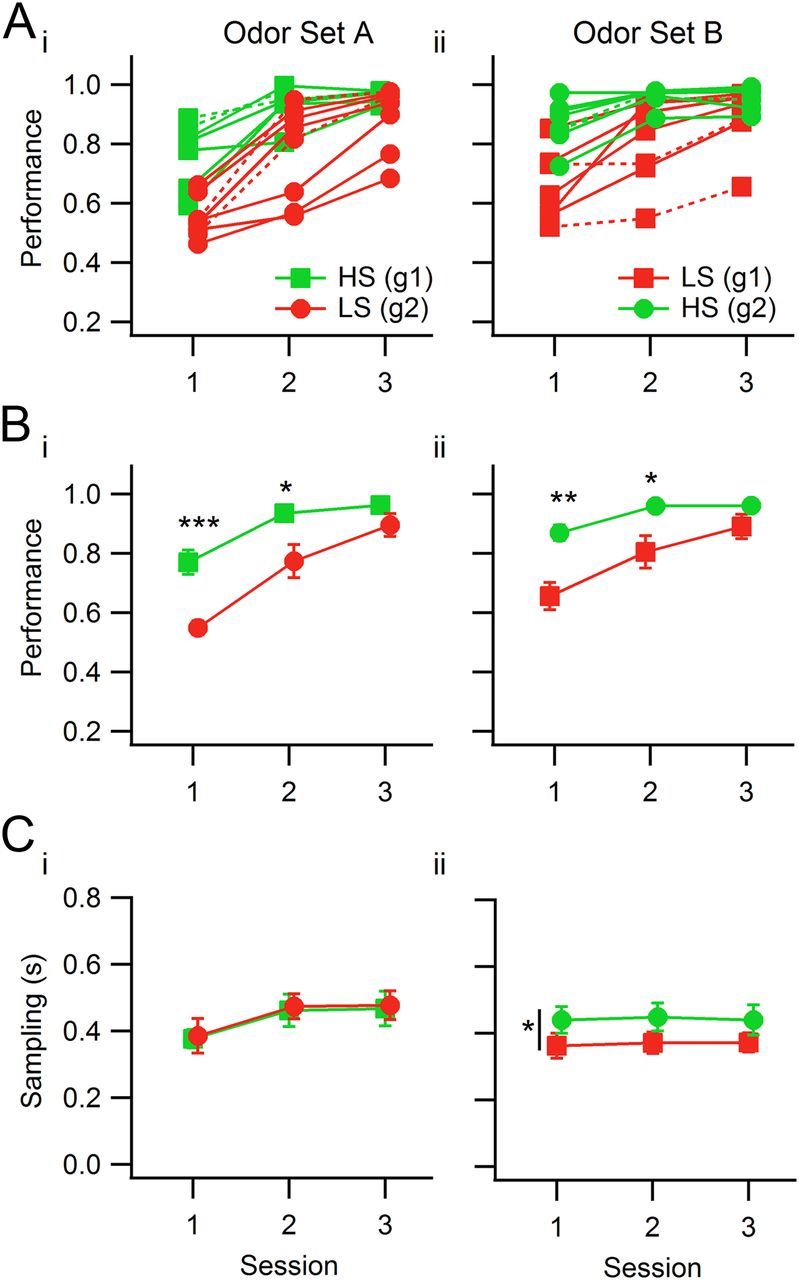
Mean session performance levels and mixture sampling duration for both odor sets. In this and in the following plots, green represents rats detecting the HS odorant target, and red represents rats detecting the LS odorant target within an odor set. Ai, Aii, Individual rats' session performance values for odor set A (Ai) and odor set B (Aii). The groups (g1, Group 1, squares; g2, Group 2, circles) refer to groups of individual rats. For odor set A, Group 1 detected the HS odorant, and Group 2 detected the LS odorant. For odor set B, Group 1 detected the LS odorant, and Group 2 the HS odorant. Dashed curves correspond to rats without diaphragm electrodes (two per group). Bi, Bii, Group performance statistics for odor sets A and B. Ci, Cii, Sampling duration means for the two odor sets. There were no significant differences between groups for odor set A, but the two groups differed in sampling duration for odor set B, although there were no significant within-session pairwise differences between groups. The vertical bar with the asterisk represents a significant difference in sampling duration for the two groups of rats. Markers correspond to the group mean of individual rats' means (for performance) or medians (for sampling duration), and error bars correspond to SEM for the group. *p < 0.05; **p < 0.01; ***p < 0.001.