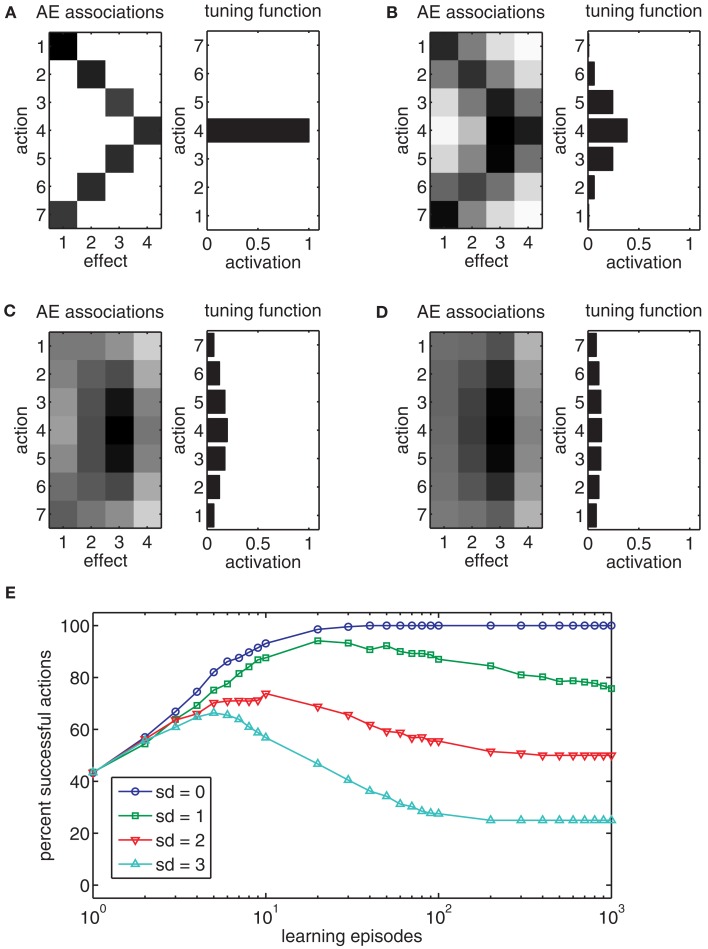
Figure 4.
(A–D) The left chart of each panel shows the action-effect (AE) associations after 1000 episodes (darker squares indicate stronger associations) with different Gaussian action turning functions (SD = 0.0, 1.0, 2.0, 3.0). The right chart of each panel shows the exemplar tuning functions for action 4. (E) The chart shows the effect of the action tuning function on the performance of the model.

