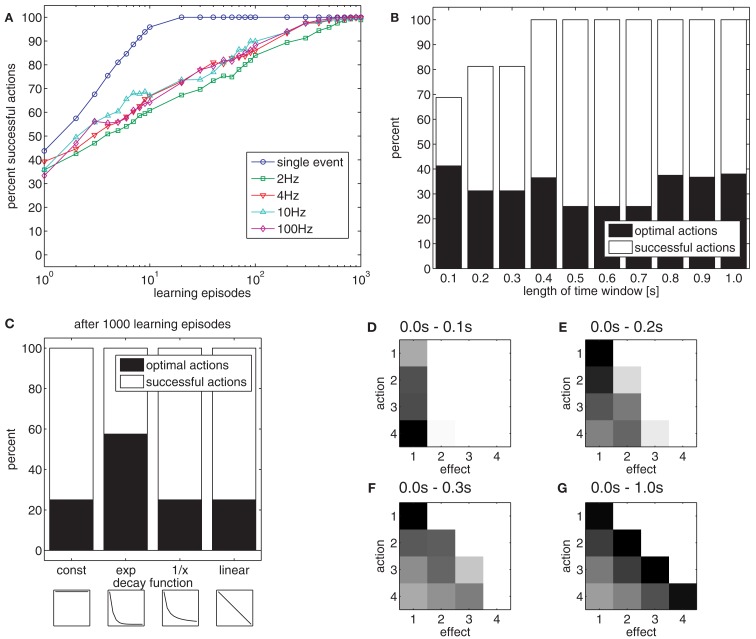
Figure 5.
(A) The chart shows the effect of the different sampling rates on learning if effects unfold dynamically in time. (B) The chart shows the effect of time windows of different length on the acquisition of an effective (white) and optimal (black) action-effect mapping. (C) The chart shows the effect of different trace decay functions. The insets show the decay functions between 0.0 and 1.0 s after action execution: const: constant value in time window 0.0–1.0 s; exp, exponential decay; 1/x, inverse proportional; linear, linear decrease. (D–G) The charts show the strengths of action-effect associations after learning of 1000 episodes with a time window of 0.1 s (D), 0.2 s (E), 0.3 s (F) and 1.0 s (G). Black squares denote strong connections between actions and effects, white squares denote no connections.

