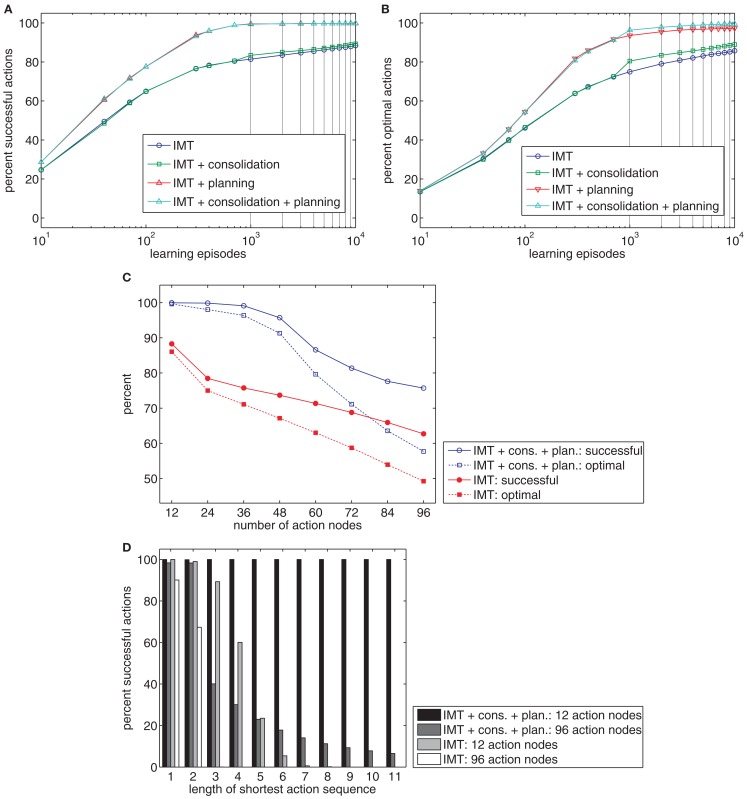
Figure 7.
(A,B) The charts show the percentage of goals reached (A) or reached in the most efficient way (B) after different numbers of learning episodes. Four models were tested: pure Ideomotor Theory (IMT), an extension of IMT with a consolidation mechanism, an extension of IMT with a planning mechanism, and an extension of IMT with both kinds of mechanisms. (C) The chart shows the percentage of successful and optimal actions for learning tasks with different numbers of action nodes for the pure IMT model or models with consolidation and planning. (D) The chart shows the percentage of successful actions by the shortest action sequence length required to reach a goal.

