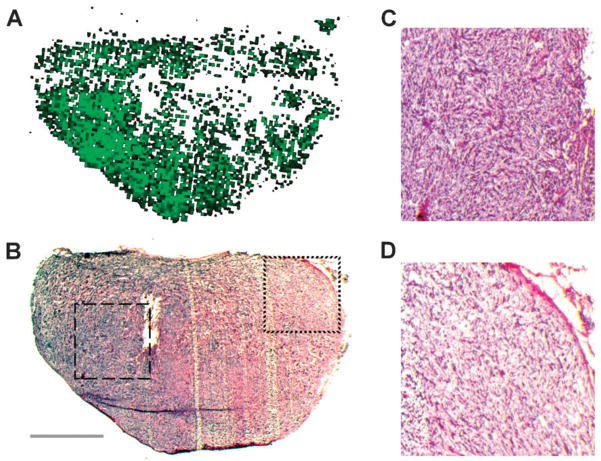
Fig. 5. Histological analysis of the tumor tissue.
The detected regions match morphological characteristics identified by H&E staining. (A) Localization of region 2 in tissue section 24. (B) H&E stain of tissue section 24 revealing different cell densities within the tissue. Dashed box shows tissue section enlarged in panel C, dotted box shows tissue section enlarged in panel D. Scale bar represents 2 mm. (C) Enlarged image of cells from region 2 shows high cell density. (D) Enlarged image of cells from region 1 shows low cell density.

