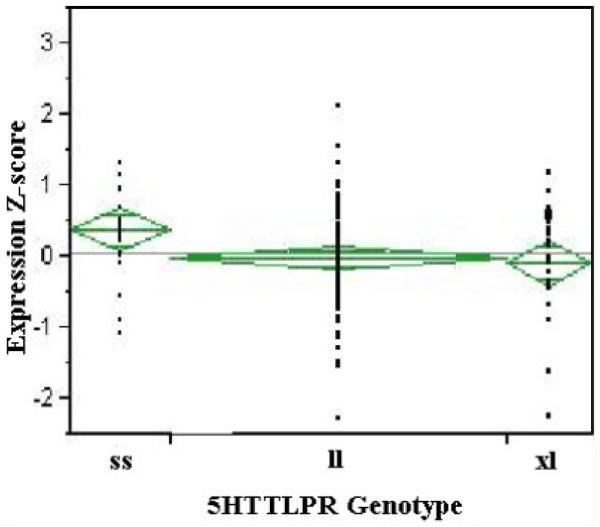
FIG. 1.

The relationship between 5HTTLPR genotype and SLC6A4 transcript levels in lymphoblast RNA prepared from blood contributed by female FACHS subjects. Higher z-scores denote lower levels of expression with each unit of z-score being equal to approximately 1.6 Ct counts. Group sizes: ss (n = 26), ll (n = 86), or at least one xl allele (n = 24). [Color figure can be seen in the online version of this article, available at http://wileyonlinelibrary.com/journal/ajmgb]
