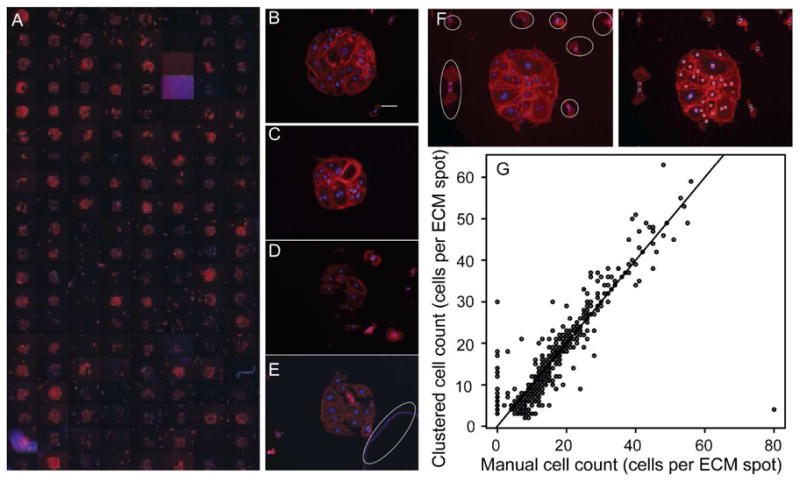
Figure 2.

Combinatorial ECM-cardiac side population (CSP) cell microarrays. (A) A mosaic of fluorescent images of a combinatorial ECM microarray seeded with 10,000 CSP cells per cm2. Images were acquired at 10X magnification after 12 hours of culture and show phalloidin (red) and nuclear (blue) staining. The mosaic image shows one of four sub-arrays per glass slide. Each sub- array contains five replicates of 30 combinations of Fn, Lm, CI, CIII, and CIV (300 μg/mL total protein concentration) and five replicates of negative controls with no protein and five replicates containing 300 μg/mL of BSA. Sets of five replicates in each sub-array are randomly ordered. (B–E) Selected images of microarrayed spots that are of high quality (B,C), low quality (D), and damaged or contain debris (E; debris is circle in white). The brightness of image (E) has been increase so that the identified debris is clearly visible. Scale bar is 100 μm. (F) Fluorescent image of a single microarrayed spot with adhered CSP cells (left) with outliers from the microarrayed spot circled in white. Cells within a cluster are identified with a red spot, while cells outside of the cluster are identified with a black spot (right). Phalloidin stain is shown in red, while the nuclei are shown in blue. (G) Correlation of CSP cells per microarrayed spot as determined by counting each cell through visual inspection and by identification with the OPTICS clustering algorithm.
