Figure 3.
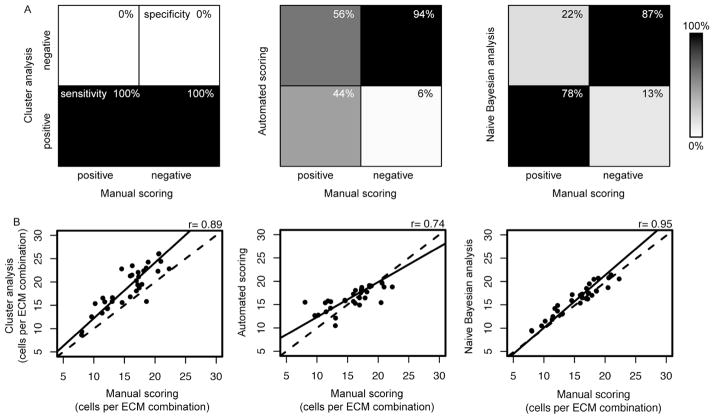
Comparison of quality control methods for cell attachment on combinatorial cell-ECM microarrays. (A) Graphical representations of the sensitivity and specificity of data from cluster analysis, automated scoring, and naïve Bayesian analysis. In a perfect dataset all high or low quality spots scored manually would also be considered high or low quality, respectively, by the quality control strategies (100% sensitive and 100% specific). (A, left) The clustered dataset was 100% sensitive (lower left quadrant) and 0% specific (upper right quadrant). (A, middle, right) The automated scoring quality control resulted in 44% sensitivity and 94% specificity, while the naïve Bayesian analysis quality control resulted in 78% sensitivity and 87% specificity. (B) Correlations of the average number of cells per ECM combination resultant from the cluster analysis (left), the automated scoring (middle), and naïve Bayesian analysis (right). The dashed line is x = y, and the solid line is a linear fit to the correlated data.

