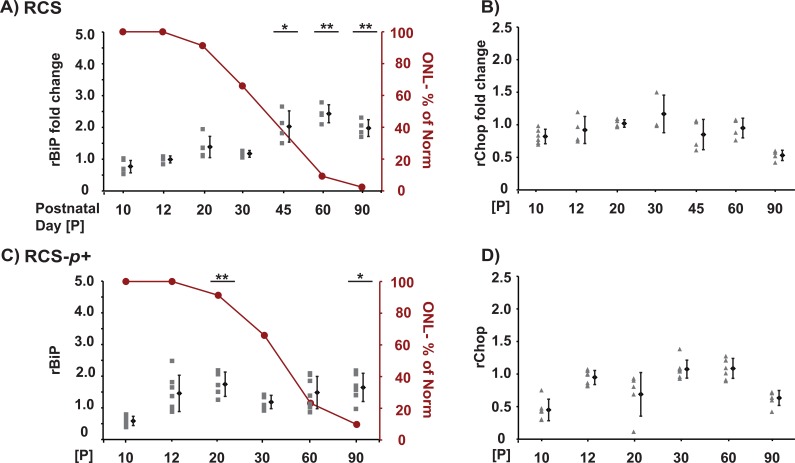
Figure 3. .
Induction of BiP and Chop in retinas of RCS rats. Analysis of BiP and Chop mRNA levels by quantitative PCR using rat retinas at indicated postnatal day ages (P). Samples were plotted relative to average of gene levels of wild-type RCS-rdy+ control animals at the same age. (A) BiP and (B) Chop mRNA levels of RCS animals. (C) BiP and (D) Chop mRNA levels of RCS-p+ animals. (A–D) Retinas from three to eight animals were collected for each postnatal day age, and the gene expression level from each animal is plotted individually at each time point. The mean value and SD for the cohort of animals at each time point are plotted to the right. The amount of degeneration is graphically presented as a percent of the normal ONL thickness at each time point as red line for each animal model (A, C). P values represent the following asterisk system: *P < 0.05, **P < 0.005.

