Figure 4. .
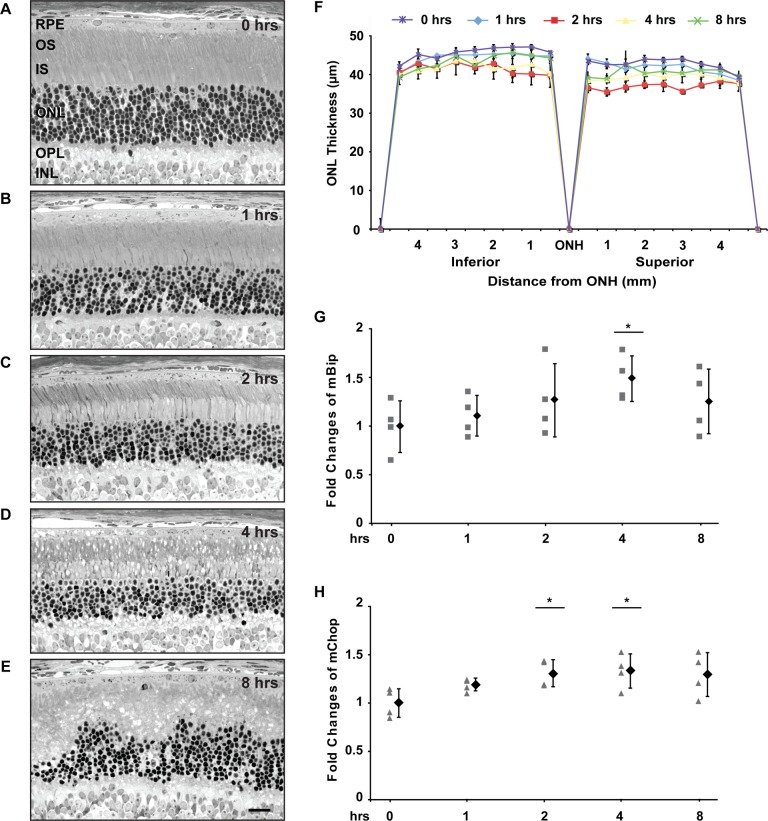
Induction of BiP and Chop in retinas of BALB/c mice exposed to constant light. Light micrograph of representative retinal section from the inferior posterior retina of BALB/c mice; (A) control BALB/c mice, (B) 1 hour, (C) 2 hours, (D) 4 hours, (E) 8 hours of CL. (F) Thickness of ONL in BALB/c mice exposed to CL for indicated durations. Measurements of the ONL thickness at indicated intervals from optic nerve head to superior and inferior poles from three different animals were collected at each constant light condition, and the mean values are plotted. Vertical bar indicates SD. Note, that all of these values are relatively similar, since a single rod photoreceptor nucleus is approximately 4.5 μm in diameter; the mean ONL thickness for the groups that are significantly different (P < 0.05) are the 2 hour light exposure compared with controls and with the 1 hour group. (G, H) Retinas from four mice were collected at indicated times points; gene expression levels of BiP (G) and Chop (H) were measured by quantitative PCR and are presented as relatives to the average levels of mice at time 0. Each animal is plotted individually. The mean value and SD for the cohort of animals is plotted to the right at each time point. P values represent the following asterisk system: *P < 0.05. INL, inner nuclear layer; IS, inner segments; OPL, outer plexiform layer; OS, outer segments; Magnification bar for A–E = 20 μm.

