Figure 4. .
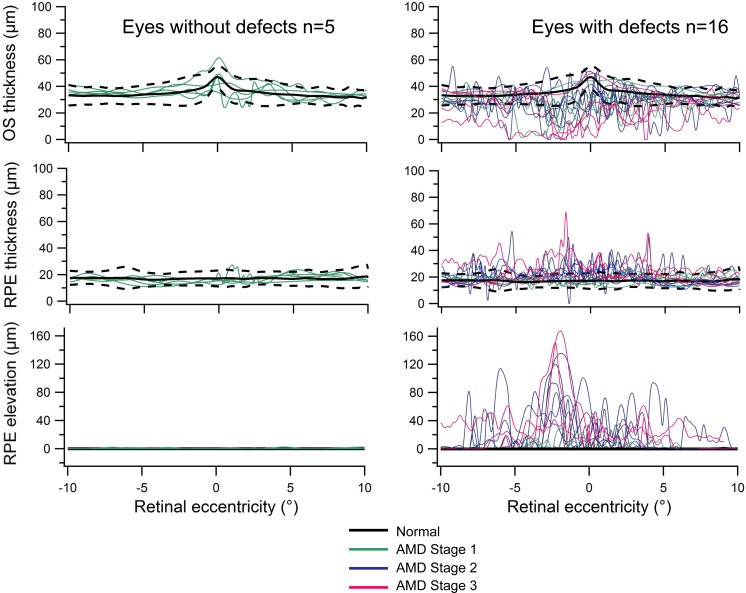
OS and RPE thickness plots. Foveal line scan thicknesses of the RPE and OS layers, as a function of retinal eccentricity for normal subjects (black lines) and for each subject with AMD (colored lines). The black dotted lines indicate the 95% confidence interval around the mean normal values (for n = 15 normal controls). The left panel shows eyes without MP-1 visual field defects (n = 5) and the right panel shows eyes with defects (n = 16).

