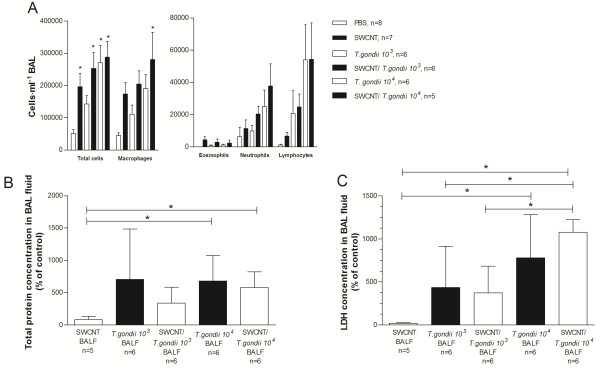
Figure 2.
Analysis of cell number and composition in BAL fluid. A . Total number of cells and composition of cells in BAL fluid in C57BL/6 mice after exposure of SWCNT and T. gondii infection (n = 5-8). Data are presented as mean ± SEM. B. Protein content of BAL fluid. Results are presented as percentage of control (PBS treated mice) ± SD from triplicate of six mice divided into two experiments. C. LDH content of BAL fluid. Results are presented as percentage of control (PBS treated mice) ± SD from triplicate of five-six mice divided into two experiments. Statistical significance was determined with one-way ANOVA or Kruskal-Wallis test using Gaussian approximation and Bonferroni’s Multiple Comparison test. * = p < 0.05, indicate significant differences between groups. In panel A, * = p < 0.05 significant differences to PBS controls.

