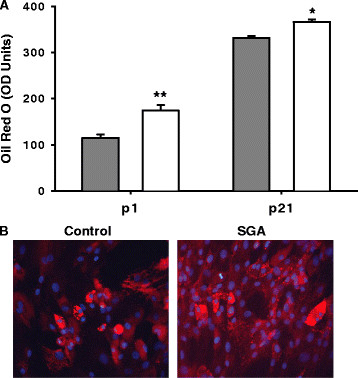
Figure 2.
Oil Red O (ORO) staining in Control and SGA adipocytes. Gray bars represent Controls, and white bars represent SGA. (A) SGA adipocytes exhibit greater triglyceride accumulation than Controls at both p1 and p21. (B) SGA adipocytes at p21 demonstrate increased lipid accumulation at 40X magnification by ORO with DAPI staining. *p < 0.05, **p < 0.01.

