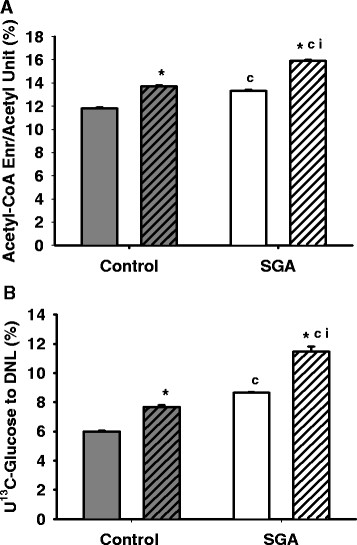
Figure 5.
Acetyl-CoA enrichment and U13C-glucose contribution to de novo lipogenesis (DNL). Gray bars represent Controls, and white bars represent SGA. Solid bars represent adipocytes untreated at baseline, and hatched bars represent adipocytes treated with 10 μM rosiglitazone. (A) SGA adipocytes exhibited increased acetyl-CoA enrichment, and therefore, (B) increased U13C-glucose contribution to de novo synthesis of palmitate. There was a significant interaction between SGA and rosiglitazone for each of these measures. *p < 0.05 compared to untreated state within the same group, cp < 0.05 compared to Controls receiving the same treatment, i interaction with rosiglitazone.

