
Figure 1.
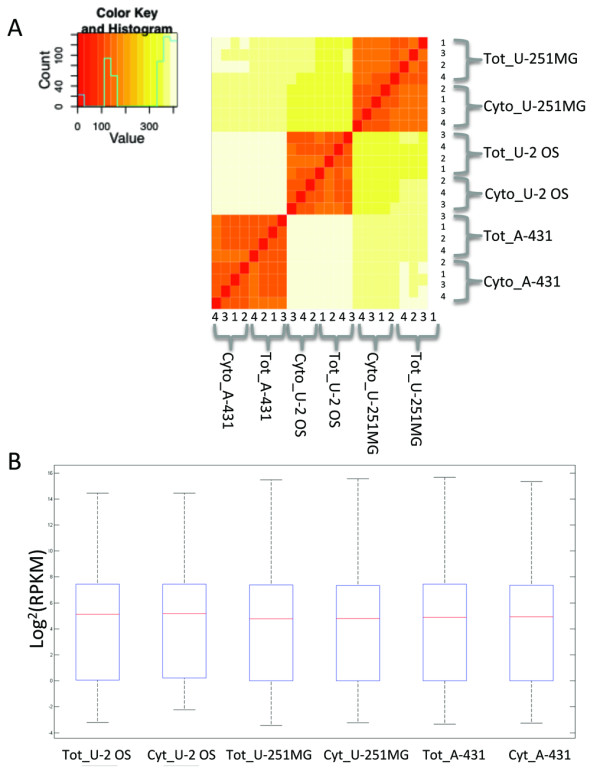
Distribution of gene expressions for the total and cytoplasmic preparation. A: Heatmap of sample preparation and cell lines. B: The distribution of all RPKM values for total and cytoplasmic RNA for the three cell lines U-2 OS, U-251MG, and A-431. The mean RPKM values for total and cytoplasmic RNA of each cell line did not differ significantly (p < 0.05).