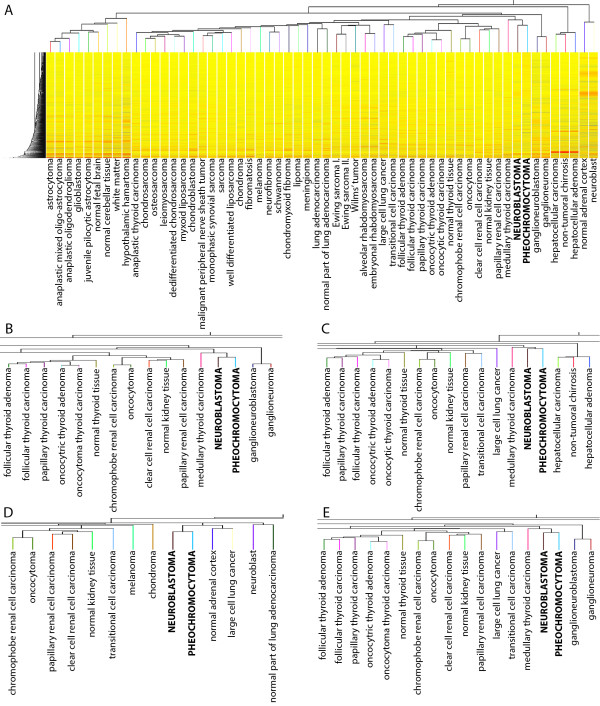
Figure 1.
Cluster analysis of NB and PCC with 369 randomly selected samples from tumors and normal tissues representing 54 endo-, meso- and ectodermic tissues, by calculating A: Euclidean, B: Squared Euclidean, C: Manhattan, D: Differential, E: Chebyshev distance metric and using the averaged linkage rule.

