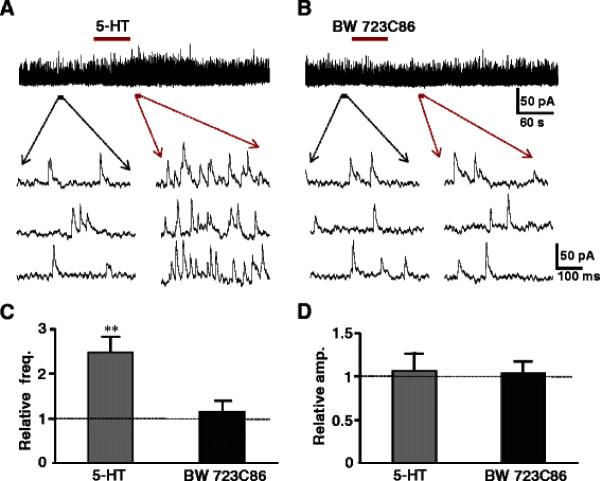
Figure 7.
Effects of 5-HT2B receptor agonist and antagonist on sIPSCs. (A) Sample trace of sIPSCs recorded before, during and after the application of 5-HT (50 μM). Lower traces show sIPSCs before (left) and after (right) the application of 5-HT in the expanded time scale. (B) shows the same neuron (A) sample trace of sIPSCs recorded before, during and after the application of 5-HT2B receptor agonist BW 723 C86 (10 μM). Lower races show sIPSCs before (left) and after (right) application of BW 723 C86. The bar graph shows the relative frequency (C), and amplitude (D) for 5-HT and BW 723 C86, respectively (paired t-test, ** P < 0.01, n = 7).

