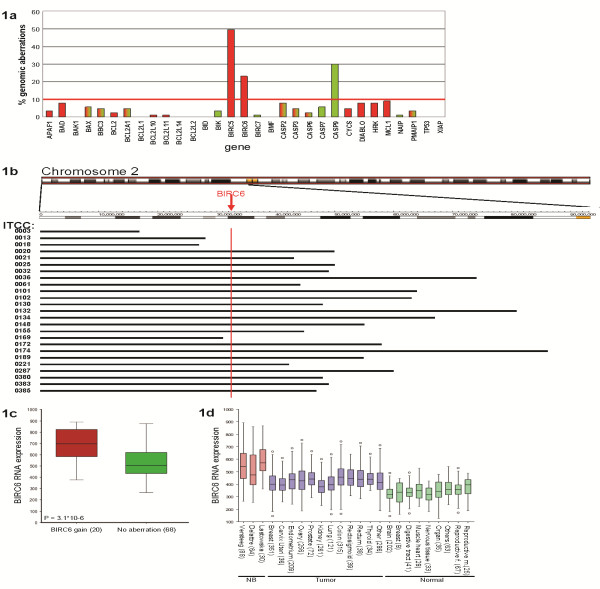
Figure 1.
Gain of BIRC5 and BIRC6 and loss of CASP9 in neuroblastoma tumors. a: The percentage of genomic aberrations is presented on the Y-axis and all selected genes in the intrinsic apoptotic pathway on the X-axis. Red bars indicate gained genes and green bars indicate lost genes. When a bar is green/red combined, it means that both gains and losses in that gene occurred. The red horizontal line represents the cut-off for further analysis. b: Chromosome 2 is represented with the regions of 2p that are gained in our dataset of 88 neuroblastoma tumors. The BIRC6 locus is indicated with a red arrow. c: Boxplots of BIRC6 mRNA expression in tumors with or without gain of BIRC6. d: Boxplots of BIRC6 mRNA expression in 3 neuroblastoma datasets (red), adult tumors (blue) and various normal tissues (green). The boxes represent the 25th to 75th percentile with the median depicted as a horizontal line. Extremes are indicated by the whiskers, and the presence of outliers is indicated by (o).

