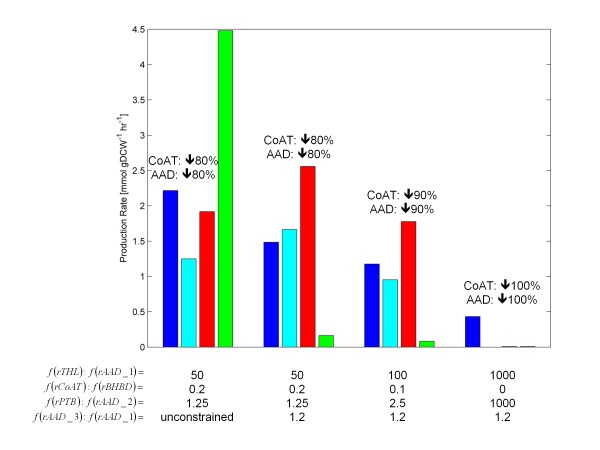
Figure 7.
FBrAtio predictions using the iCAC490 model given various levels of CoAT and AAD knockdown. Shown are predictions of growth (x10) (blue), acetone (cyan), butanol (red), and ethanol (green) during solventogenesis (SPF = 5). The following flux ratio constraints were applied: (i) f(rTHL):f(rAAD_1), (ii) f(rCoAT):f(rBHBD), (iii) f(rPTB):f(rAAD_2), and (iv) f(rAAD_3):f(rAAD_1). The following were held constant: (i) glucose uptake rate of , (ii) constraints listed in Table 1, (iii) f(rTHL):f(rPTA) = 2, (iv) f(CO2export):f(CO2conversion) = 5, (v) f(rPFO):f(rLDH) = 10, and (vi) f(rCoAT, butyrate):f(rCoAT, acetate) = 0.63.

