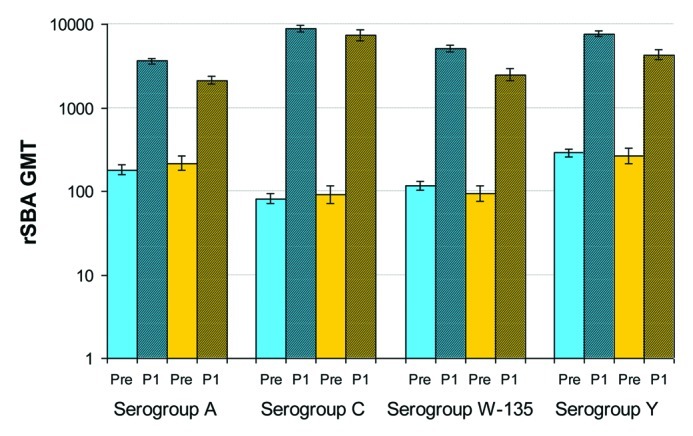
Figure 2. rSBA GMTs (with 95% CIs) before and one month after vaccination (ATP immunogenicity cohort). Pre, pre-vaccination (plain columns); P1, 1 mo post vaccination (hatched columns). Blue bars, ACWY-TT group; Orange bars, MenPS group.

Figure 2. rSBA GMTs (with 95% CIs) before and one month after vaccination (ATP immunogenicity cohort). Pre, pre-vaccination (plain columns); P1, 1 mo post vaccination (hatched columns). Blue bars, ACWY-TT group; Orange bars, MenPS group.