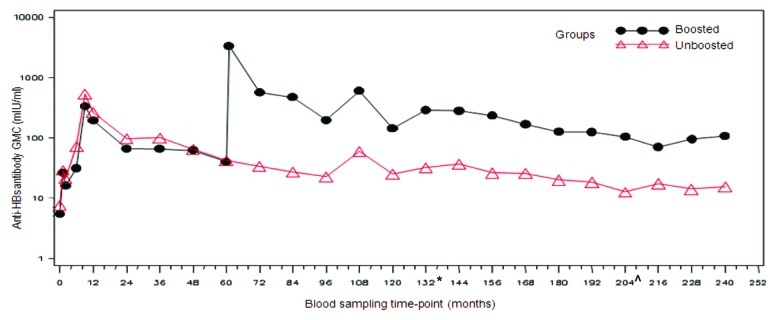
Figure 2. Evolution of anti-HBs geometric mean concentrations in boosted and unboosted groups (LT-ATP immunogenicity cohort). Boosted group: Subjects who received booster dose at year 5 (month 60). Unboosted group: Subjects who did not receive the booster dose at year 5 (month 60). Note: At year 9 the results of only 10 subjects were included in the analysis- hence this time point should not be taken into account to assess the kinetic of the immune response. This limited number of subjects was due to logistic problems during the conduct of the study which resulted in fewer subjets being loaded into the database. From the commencement of primary vaccination until follow-up year 10, anti-HBs antibodies were measured using AUSAB RIA (Abbott Laboratories). *Assay change from year 11 until year 16: Antibodies were measured using AUSAB EIA (Abbott Laboratories, IL, USA). ^Assay change from year 17 until year 20: Antibodies were measured using an in-house validated ELISA.

An official website of the United States government
Here's how you know
Official websites use .gov
A
.gov website belongs to an official
government organization in the United States.
Secure .gov websites use HTTPS
A lock (
) or https:// means you've safely
connected to the .gov website. Share sensitive
information only on official, secure websites.
