
Figure 3.
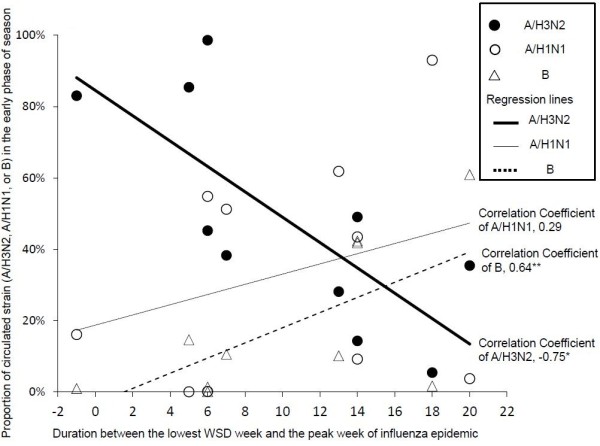
Association between the duration weeks and the proportions of circulated influenza type/subtype. The relationship between duration weeks (x axis) and the proportion of types and subtypes of circulated influenza virus (y axis) are represented in the technical graph. *Significant negative association with the proportion of influenza A/H3N2 cases in early phase of the epidemic (correlation coefficient was −0.75 with P value = 0.012), and **significant positive association with the proportion of influenza B cases in early phase of the epidemic (correlation coefficient was 0.64 with P value = 0.045).