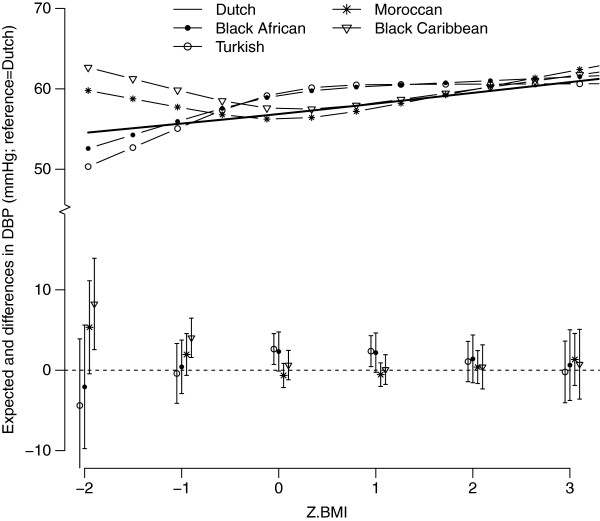
Figure 3.
The expected (lines) and mean differences (Dutch=reference) between z-BMI and DBP for the different ethnic groups, adjusted for sex, mean age (5.7 years), height (117 cm) and mean birth weight (3489 g). The lines (top part) represent the expected DBP values for each ethnic group. The bottom part represents the mean differences in DBP for each ethnic group compared to the ethnic Dutch group (reference group) including the 95% confidence intervals. Both are plotted as a function of child’s BMI z-score.

