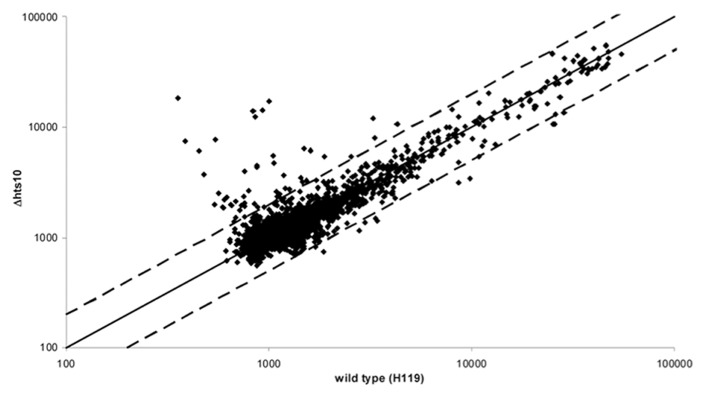
Figure 5. Comparison of the transcriptomes of mutant Δhts10 and parent strain H119. Both strains were grown to mid-exponential growth phase. RNA was isolated from three independent cultures each and compared using a self-constructed DNA microarray (compare Materials and Methods). Average values of the signals for the transcripts of the mutant (y-axis) and the parent strain (x-axis) are shown. The solid line represents the diagonal and the two broken lines a 2-fold difference between mutant and parent strain.

An official website of the United States government
Here's how you know
Official websites use .gov
A
.gov website belongs to an official
government organization in the United States.
Secure .gov websites use HTTPS
A lock (
) or https:// means you've safely
connected to the .gov website. Share sensitive
information only on official, secure websites.
