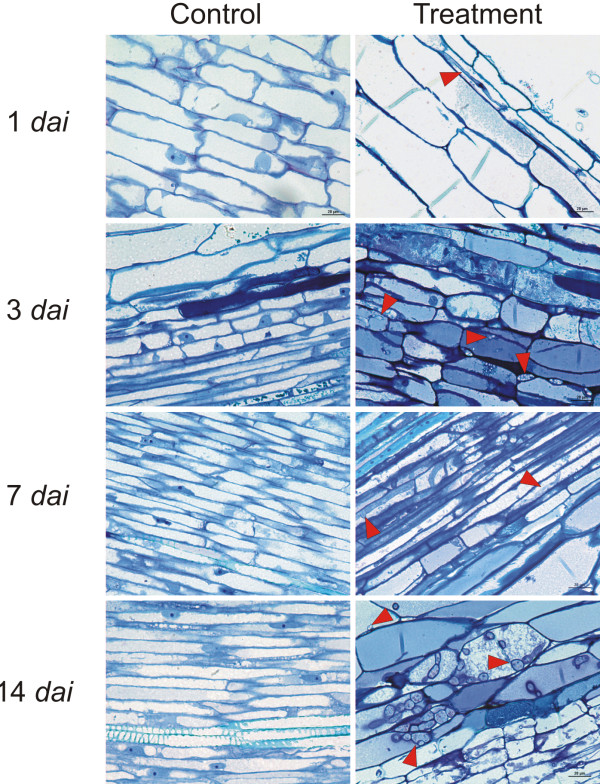
Figure 1.
Comparison of images of treated and control root sections over time (1–14 dai). All the sections represent vascular tissue, except the images from 1 dai, which belong to the outer cortex (at this sampling time, the pathogen was not found in other sections). Some pathogen structures are indicated by red arrowheads in all the treated sections

