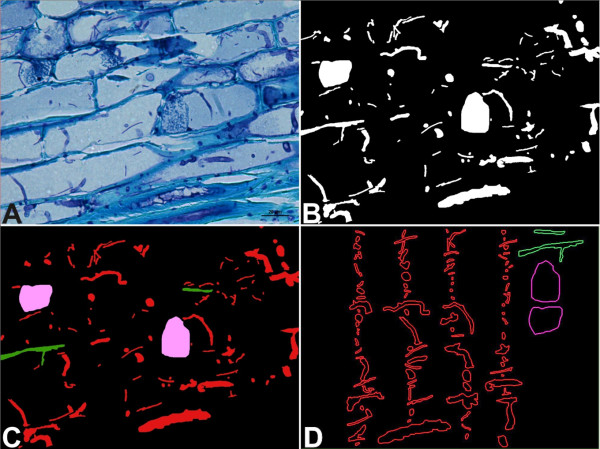
Figure 5.
Acquisition of measurable regions of pathogen colonization through image treatment. A, Captured image from microscopy analysis. B, First representation map obtained from the subtractive masks, which represents the TSA. C, Color map after transformation (see Table 1 for Representative area color). D, Measurables structures in CAD files.

