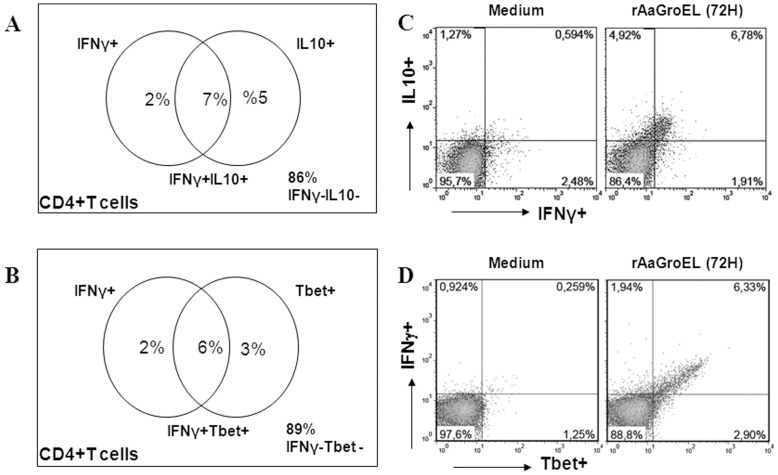
Figure 4. GroEL responding CD4+ T cells double cytokine producers.
PBMCs cultured from 24 h to 96 h with rAaGroEL (20 µg/ml). RPMI and PMA/I were used as negative and positive controls respectively. At indicated time points CD4 cell surface staining was performed. Then, IFNγ, IL10 and T-bet antibodies were added to fixed and permed cells. Cells were acquired and analyzed. For each molecule analysis, cells were gated for CD4+ T cells. (A) shows representative distribution of IFNγ+IL-10+ double positive T cells, (B) shows representative distribution IFNγ+T-bet+ double positive T cells. (C) and (D) show representative flow data of double cytokine producing CD4+ T cells.

