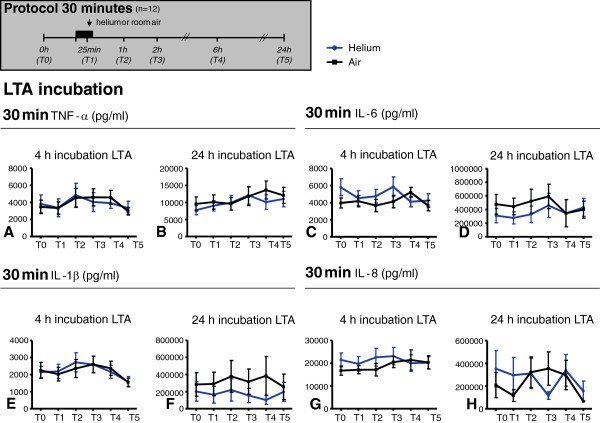
Figure 4.
TNF-α (panel A-B), IL-6 (panel C-D), IL-1β (panel E-F) and IL-8 (panel G-H) levels in plasma after 4 and 24 hours incubation with LTA. Time points on y-axis represent blood sampling time points shown in the experimental protocols above. Panels show 30 minutes of inhalation. Data shown are means +/− SEM. Experimental protocol is shown above; T0: baseline, T1: at 25 min inhalation, T2: 1 h after inhalation, T3: 2 h after inhalation, T4: 6 h after inhalation, T5: 24 h after inhalation.

