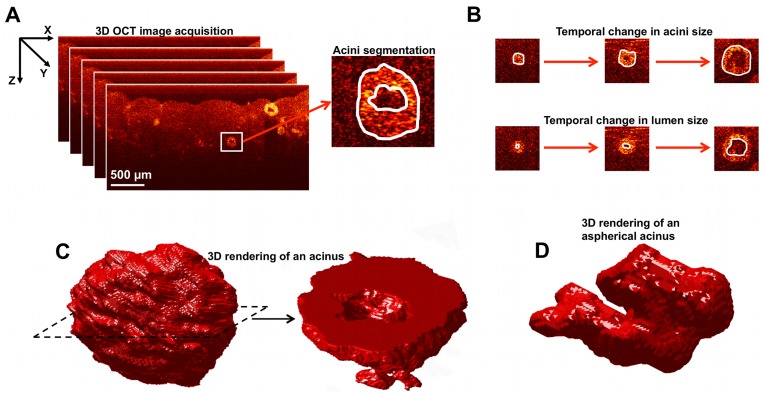
Figure 1. 3D-OCT image acquisition of the co-cultures, and analysis of the shape and size of acini.
A. 3D-OCT image acquistion: the surface of the gel is aligned near the top of each image, and the depth-resolved light scattering from cells beneath the gel surface is apparent at depths up to ∼1 mm; segmentation of acini to characterize the overall size and the lumen is also shown. B. Temporal changes in acini and lumen sizes analyzed from 3D-OCT images of the co-cultures. C. An example isosurface rendering of an acinus from a 3D-OCT image-stack; slicing of the rendered volume clearly shows the lumen. D. An example 3D rendering of an aspherical acinus.

