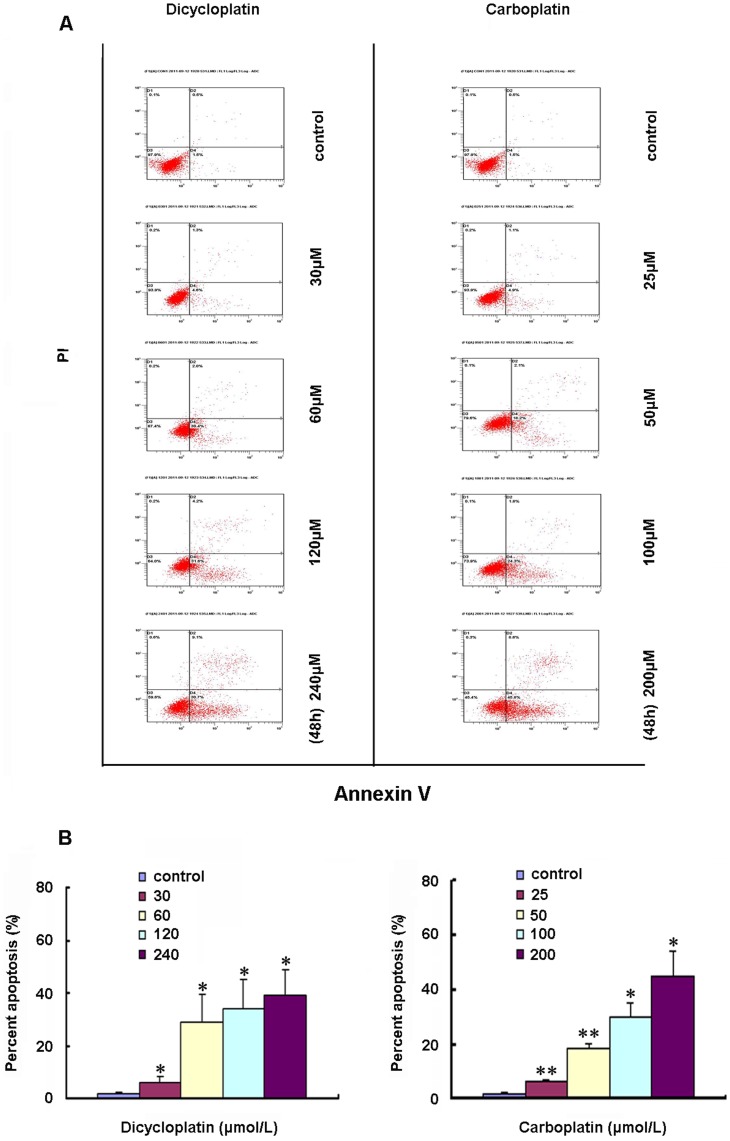
Figure 2. Induction of apoptosis by dicycloplatin in HepG2 cells.
A, apoptosis analysis in HepG2 cells was assessed by Annexin V/PI double staining. After cells were exposed to the three designated concentrations of dicycloplatin or carboplatin for 48 h, respectively, the attached and detached cells were collected. Following staining with Annexin V and PI, cells were subjected to flow cytometry analysis. Bottom right quadrant, cells stained mainly by Annexin V (early apoptotic cells); top right quadrant, cells stained by both PI and Annexin V (late apopototic/necrotic secondary necrosis); top left quadrant, cells stained mainly by PI viable cells; bottom left quadrant, cells negative for both Annexin V and PI. B, percent apoptosis. Early apoptotic cell population with Annexin V-positive but PI-negative cells increased gradually from 1.5% to 31.6% and 1.5% to 45% in dicycloplatin- and carboplatin-treated HepG2 cells, respectively. The data presented represents the mean±SD from three independent experiments (*, P<0.05; **, P<0.01).

