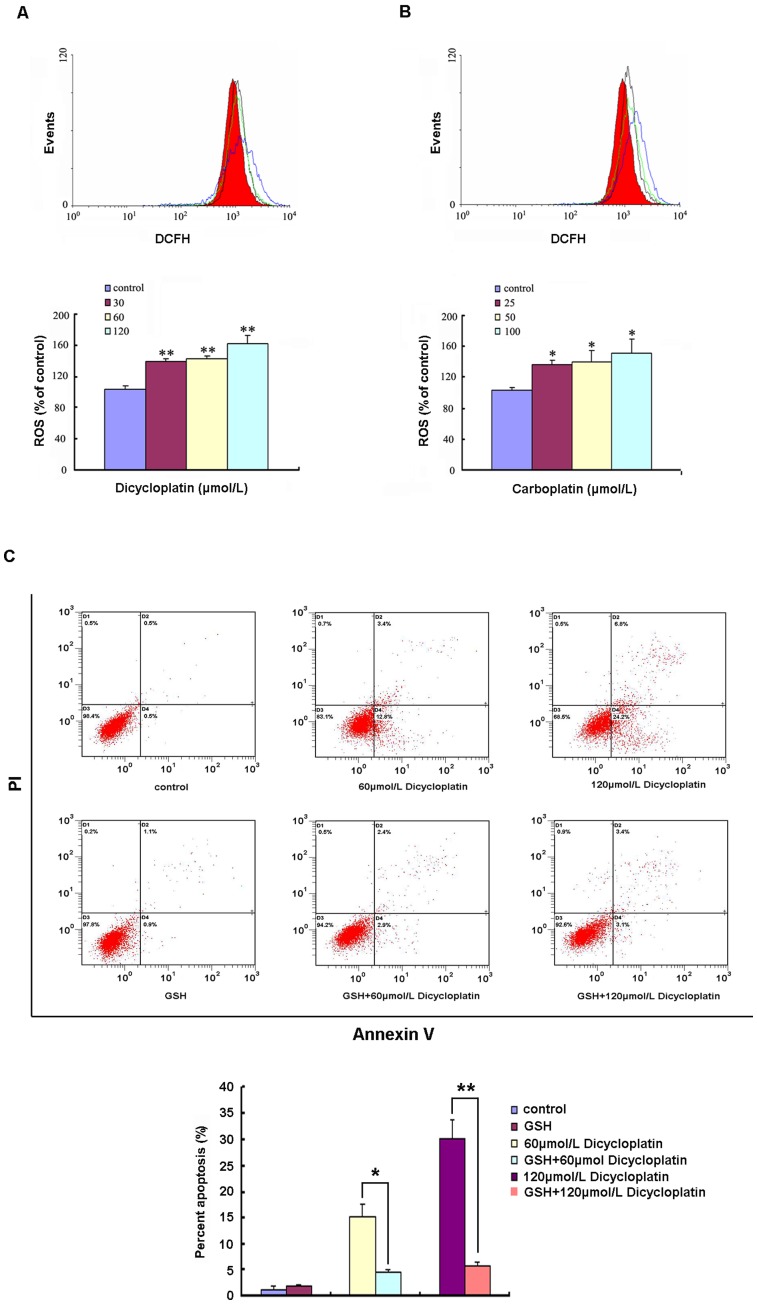
Figure 7. Induction of ROS was involved in dicycloplatin-induced apoptosis in HepG2 cells.
A and B, dicycloplatin and carboplatin induced increase of ROS generation in HepG2 cells. After HepG2 cells were exposed to 30 to 120 µmol/L dicycloplatin or 25 to 100 µmol/L carboplatin for 48 h, respectively, intracellular ROS levels were analyzed by flow cytometry. Significant increases of ROS production were observed in HepG2 cells after dicycloplatin and carboplatin treatment. Top, ROS levels in dicycloplatin and carboplatin-treated cells, respectively. Red area and black, green, and blue lines, ROS levels for untreated control and 30, 60, 120 µmol/L dicycloplatin treatment groups, or for untreated control and 25, 50, 100 µmol/L carboplatin treatment groups, respectively. Bottom, ROS levels of dicycloplatin- and carboplatin-treated cells, expressed as units of mean fluorescence intensity, were calculated as percentage of control. The data presented represents mean±SD from three independent experiments (*, P<0.05; **, P<0.01). C, GSH significantly inhibited apoptosis induced by dicycloplatin. HepG2 cells were pretreated with GSH (5 mmol/L) for 1 h and then incubated with dicycloplatin (60, 120 µmol/L) for 48 h, respectively. The attached and detached cells were collected. Following staining with Annexin V and PI, cells were subjected to flow cytometer analysis. Bottom right quadrant, cells stained mainly by Annexin V (early apoptotic cells); top right quadrant, cells stained by both PI and Annexin V (late apopototic/necrotic secondary necrosis); top left quadrant, cells stained mainly by PI viable cells; bottom left quadrant, cells negative for both Annexin V and PI. Bottom, percent apoptosis. Percent of apoptosis induced by dicycloplatin was significantly inhibited by GSH. Each data represents the mean±SD from three independent experiments (*, P<0.05; **, P<0.01).

