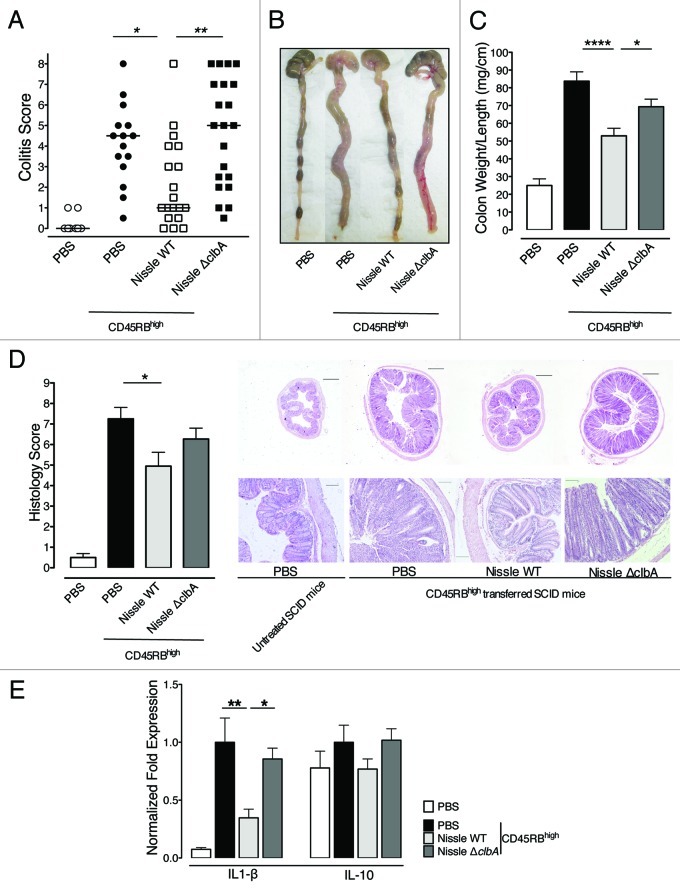
Figure 4.E. coli Nissle 1917 requires a functional pks island for attenuation of CD4+ CD45RBhigh T cell-induced colitis. The extent of colitis and colonic damage were assessed blindly before tissue samples were collected from SCID mice followed as in Figure 3. Error bars represent the SEM and the data shown are the pooled results from duplicate experiments performed in 5–11 mice per group. (A) Plotted data represent pooled colitis scores of each individual mouse and medians are indicated. *p < 0.05 and ** p < 0.01, Kruskal-Wallis test, Dunn’s multiple comparison test. (B) Representative gross organ morphologies of the cecum and colons at day 45 are shown. (C) Sampled colons were measured, rinsed with PBS and weighed. Colon length and mucosa thickening that are dependent of the severity of colitis are modulated according to the oral treatment. Means of colon weight/length ratios are represented. *p < 0.05 and **** p < 0.0001 by one-factor ANOVA analysis, Bonferroni’s multiple comparison test. (D) Colonic sections were stained with H&E to determine disease severity. Left, the scores for several parameters were summed for a total severity score. *p < 0.05, Kruskal-Wallis test, Dunn’s multiple comparison test. Right, representative H&E stained sections from mice colons are shown. Images in each row are the same magnification. Bars = 500 μm (above) or 100μm (below). The higher magnification below shows massive epithelial hyperplasia and inflammatory cell infiltration into colonic tissues in mice fed with PBS and Nissle ∆clbA compared with those fed with Nissle WT. (E) Colonic samples were homogenized for cytokine expression measurements by q-PCR. Transcriptional expression of IL-1β and IL-10 was normalized to HPRT expression. Represented fold expressions were normalized to PBS-treated colitic mice. *p < 0.05 and ** p < 0.01 by one-factor ANOVA analysis, Bonferroni’s multiple comparison test.

An official website of the United States government
Here's how you know
Official websites use .gov
A
.gov website belongs to an official
government organization in the United States.
Secure .gov websites use HTTPS
A lock (
) or https:// means you've safely
connected to the .gov website. Share sensitive
information only on official, secure websites.
