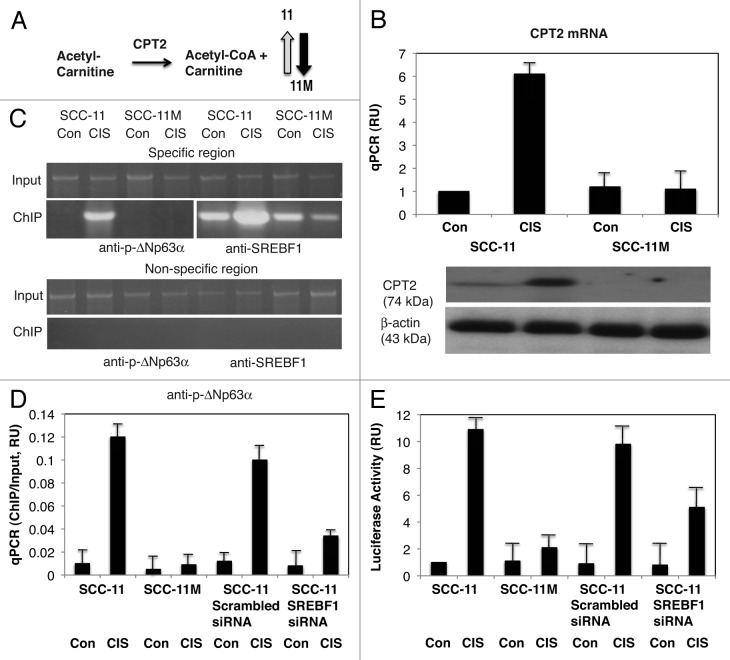
Figure 4. P-ΔNp63α induces the expression of CPT2 in SCC-11 cells upon cisplatin exposure. (A) Metabolite reaction of carnitine palmitoyltransferase 2 (CPT2). Grey arrow indicates the increase in SCC-11 cells, while black arrow indicates the decrease in SCC-11M cells. (B, upper panel) qPCR expression analysis of CPT2 mRNA obtained from SCC-11 and SCC-11M cells treated with control medium (Con) and 10 μg/ml cisplatin (CIS). The values from SCC-11 cells treated with control medium designated as 1. The qPCR values presented as relative units (RU). (B, lower panel) Immunoblot analysis of CPT2 in SCC-11 and SCC-11M cells treated with control medium (Con) or cisplatin (CIS). Loading was normalized by β-actin expression. (C) ChIP assay of the binding of p-ΔNp63α and SREBF1 to the CPT2 promoter (enrichment) in SCC-11 cells exposed to control medium (Con) and cisplatin (CIS). (D) Quantitative analysis of enrichment (ChIP/Input ratio) of the CPT2 promoter with the p-ΔNp63α and SREBF1 transcription factors in SCC-11 cells treated with cisplatin. ChiP/Input ratio values presented as relative units (RU). SCC-11 cells were transfected with the scrambled and SREBF1 siRNA and analyzed for ChIP/Input enrichment. (E) Luciferase reporter assay of the CPT2 promoter in SCC-11 and SCC-11M cells treated with control medium (Con) and cisplatin (CIS). SCC-11 cells were transfected with the scrambled and SREBF1 siRNA and analyzed for the CPT2 promoter-driven luciferase activity presented as relative units (RU). The values from SCC-11 cells treated with control medium designated as 1. All experiments were performed in triplicates. p < 0.05.

An official website of the United States government
Here's how you know
Official websites use .gov
A
.gov website belongs to an official
government organization in the United States.
Secure .gov websites use HTTPS
A lock (
) or https:// means you've safely
connected to the .gov website. Share sensitive
information only on official, secure websites.
